The platform
One system for the work, the people and the money.
Most firms run delivery in one tool, capacity in a spreadsheet and profitability in an export nobody trusts. Northstar keeps all three in the same model, updated by the work itself.
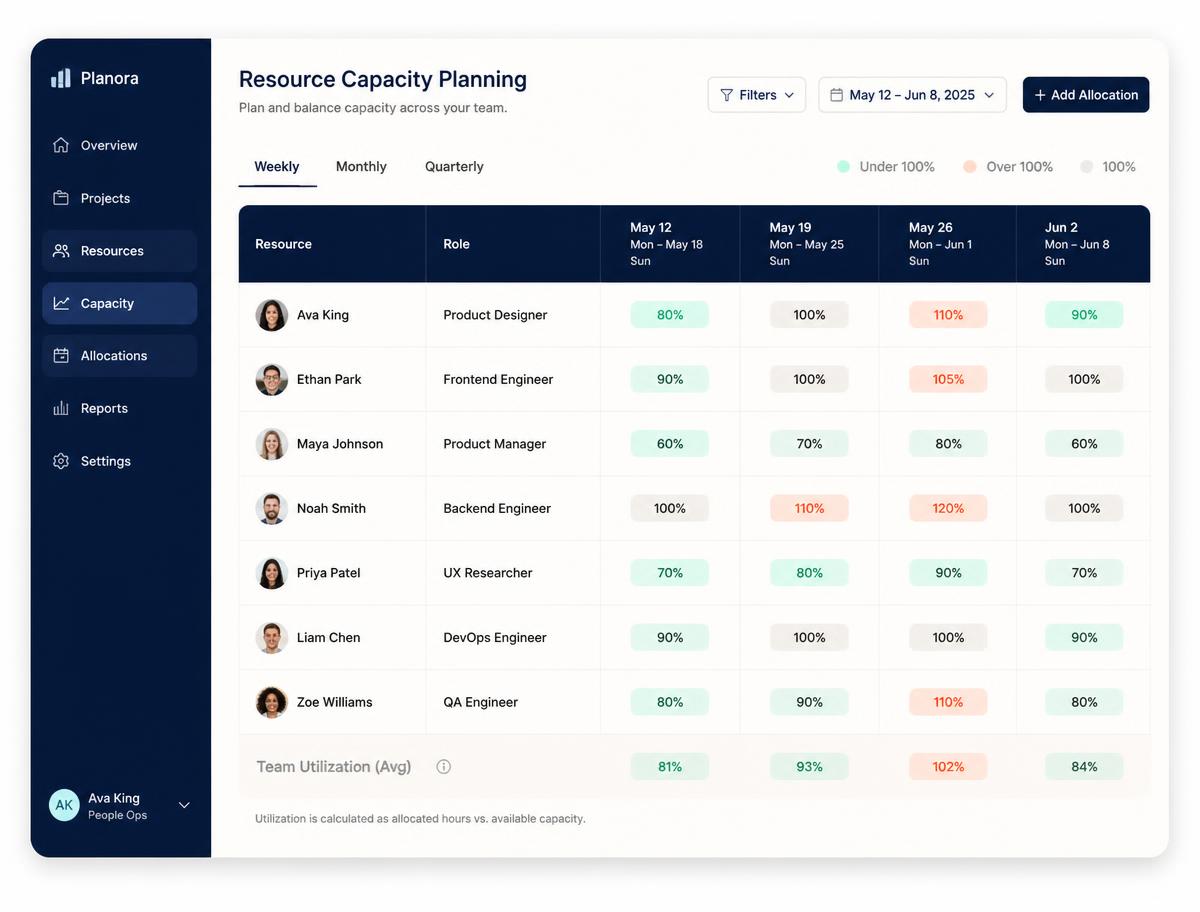
Capacity planner · rolling 12 weeks
Capacity
Know who is free before you say yes.
Northstar reads committed work, holidays, retainers and pipeline probability, then shows a single honest number per person per week. No more staffing a project on optimism and discovering the gap in month two.
- Scenario-plan an unsigned proposal without touching live plans
- Skill and seniority matching across studios and time zones
- Overtime and burnout thresholds surfaced to team leads first
- Contractor spend forecast alongside permanent capacity
Clients & margin
The client sees progress. You see profit.
A branded portal gives every account one place for status, approvals and documents — while the same underlying data drives your internal profitability view. Both stay true because they are the same record.
Portal by default
Live status without a weekly deck.
Approvals with audit
Every sign-off timestamped and attributable.
Board-ready exports
Margin, WIP and pipeline in one pack.
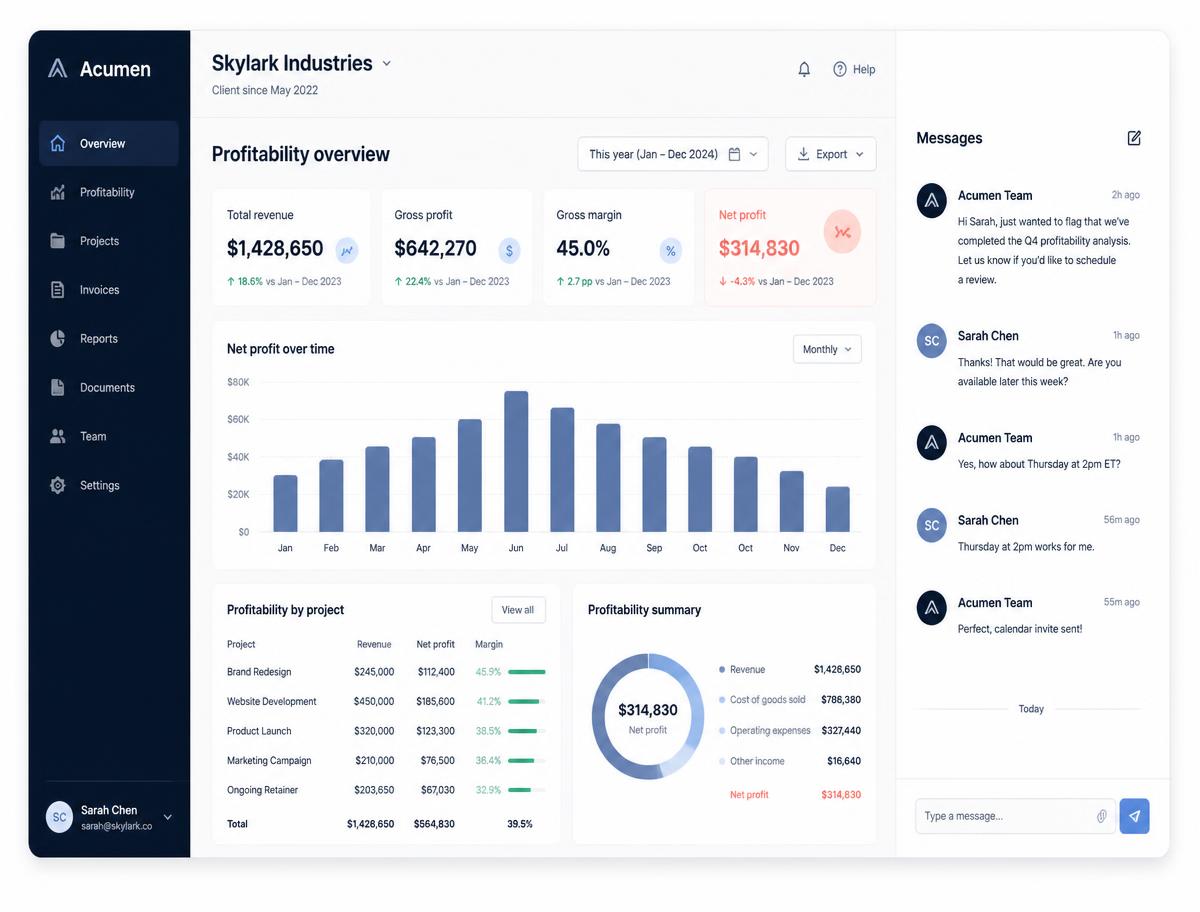
Net margin
39.5%
+2.7 pts vs. last year
Your next quarter
Stop reconciling. Start running the firm.
Bring one real engagement to the demo. We will model it live — plan, staffing and margin — and show you what your current stack is hiding.
Average time to first value: 27 days. Cancel before renewal, no penalty.
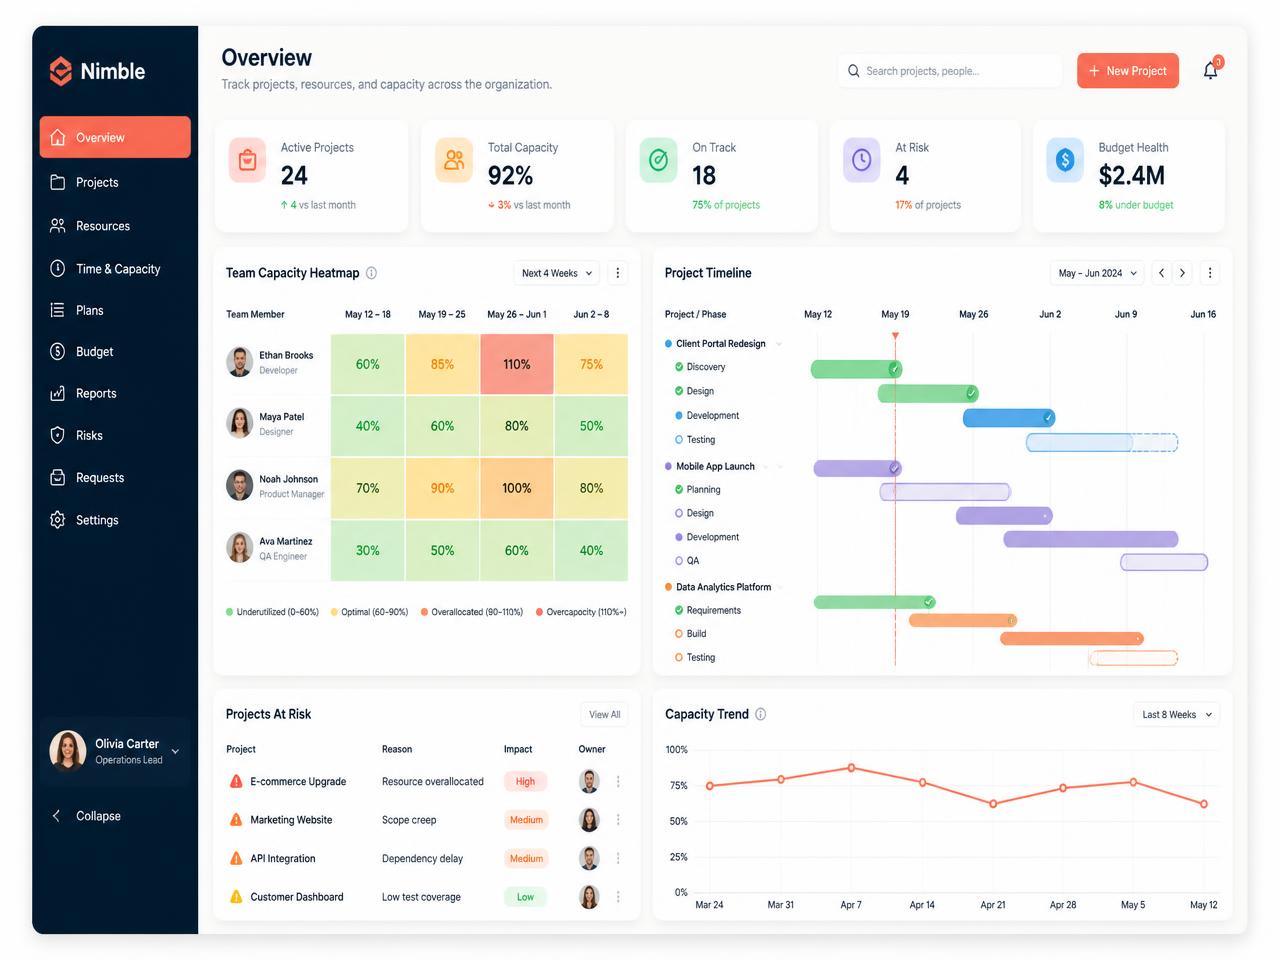
Demo slot